Show the code from previous steps
library(pins)
library(vetiver)
library(workflows)

model_board <- board_folder(path = "pins-r")
v <- vetiver_pin_read(model_board, "cars_mpg")Once a model is deployed, it is important to monitor its statistical performance. Machine learning can break quietly; a model can continue returning predictions without error, even if it is performing poorly. Often these quiet performance problems are discussed as types of model drift; data drift can occur when the statistical distribution of an input feature changes, or concept drift occurs when there is change in the relationship between the input features and the outcome.
Without monitoring for degradation, this silent failure can continue undiagnosed. The vetiver framework offers functions to fluently compute, store, and plot model metrics. These functions are particularly suited to monitoring your model using multiple performance metrics over time. Effective model monitoring is not “one size fits all”, but instead depends on choosing appropriate metrics and time aggregation for a given application.
library(pins)
library(vetiver)
library(workflows)
model_board <- board_folder(path = "pins-r")
v <- vetiver_pin_read(model_board, "cars_mpg")from vetiver import VetiverModel
from pins import board_folder
model_board = board_folder("pins-py", allow_pickle_read=True)
v = VetiverModel.from_pin(model_board, "cars_mpg")Let’s say we collect new data on fuel efficiency in cars and we want to monitor the performance of our model over time.
When a model is deployed, new data comes in over time, even if time is not a feature for prediction. Even if your model does not explicitly use any dates as features, changes (or “drift”) in your machine learning system mean that your model performance can change with time.
We can compute multiple metrics at once over a certain time aggregation.
library(vetiver)
library(tidyverse)
cars <- read_csv("https://vetiver.posit.co/get-started/new-cars.csv")
original_cars <- slice(cars, 1:14)

original_metrics <-
    augment(v, new_data = original_cars) %>%
    vetiver_compute_metrics(date_obs, "week", mpg, .pred)

original_metrics
# A tibble: 6 × 5
.index .n .metric .estimator .estimate
<date> <int> <chr> <chr> <dbl>
1 2022-03-24 7 rmse standard 4.03
2 2022-03-24 7 rsq standard 0.544
3 2022-03-24 7 mae standard 3.05
4 2022-03-31 7 rmse standard 5.69
5 2022-03-31 7 rsq standard 0.651
6 2022-03-31 7 mae standard 3.95 import vetiver
import pandas as pd
from sklearn import metrics
from datetime import timedelta
cars = pd.read_csv("https://vetiver.posit.co/get-started/new-cars.csv")
original_cars = cars.iloc[:14, :].copy()
original_cars["preds"] = v.model.predict(
original_cars.drop(columns=["date_obs", "mpg"])
)
metric_set = [metrics.mean_absolute_error, metrics.mean_squared_error, metrics.r2_score]
td = timedelta(weeks=1)
original_metrics = vetiver.compute_metrics(
data=original_cars,
date_var="date_obs",
period=td,
metric_set=metric_set,
truth="mpg",
estimate="preds",
)
original_metrics index n metric estimate
0 2022-03-24 7 mean_absolute_error 3.564286
1 2022-03-24 7 mean_squared_error 14.804849
2 2022-03-24 7 r2_score 0.226989
3 2022-03-31 7 mean_absolute_error 1.844513
4 2022-03-31 7 mean_squared_error 6.376873
5 2022-03-31 7 r2_score 0.811105You can specify which metrics to use for monitoring, and even provide your own custom metrics. You can choose appropriate metrics for what matters in your use case.
The first time you pin monitoring metrics, you can write to a board as normal.
model_board %>% pin_write(original_metrics, "tree_metrics")model_board.pin_write(original_metrics, "tree_metrics", type = "csv")However, when adding new metrics measurements to your pin as you continue to gather new data and monitor, you may have dates that overlap with those already in the pin, depending on your monitoring strategy. You can choose how to handle overlapping dates with the overwrite argument.
# dates overlap with existing metrics:
new_cars <- slice(cars, -1:-7)
new_metrics <-
    augment(v, new_data = new_cars) %>%
    vetiver_compute_metrics(date_obs, "week", mpg, .pred)

model_board %>%
    vetiver_pin_metrics(new_metrics, "tree_metrics", overwrite = TRUE)
# dates overlap with existing metrics:
new_cars = cars.iloc[7:, :].copy()
new_cars["preds"] = v.model.predict(
new_cars.drop(columns=["date_obs", "mpg"])
)
new_metrics = vetiver.compute_metrics(
data = new_cars,
date_var = "date_obs",
period = td,
metric_set = metric_set,
truth = "mpg",
estimate = "preds"
)
vetiver.pin_metrics(
model_board,
new_metrics,
"tree_metrics",
overwrite = True
)You can visualize your set of computed metrics and your model’s performance1.
library(ggplot2)
monitoring_metrics <- model_board %>% pin_read("tree_metrics")
vetiver_plot_metrics(monitoring_metrics) +
    scale_size(range = c(2, 4))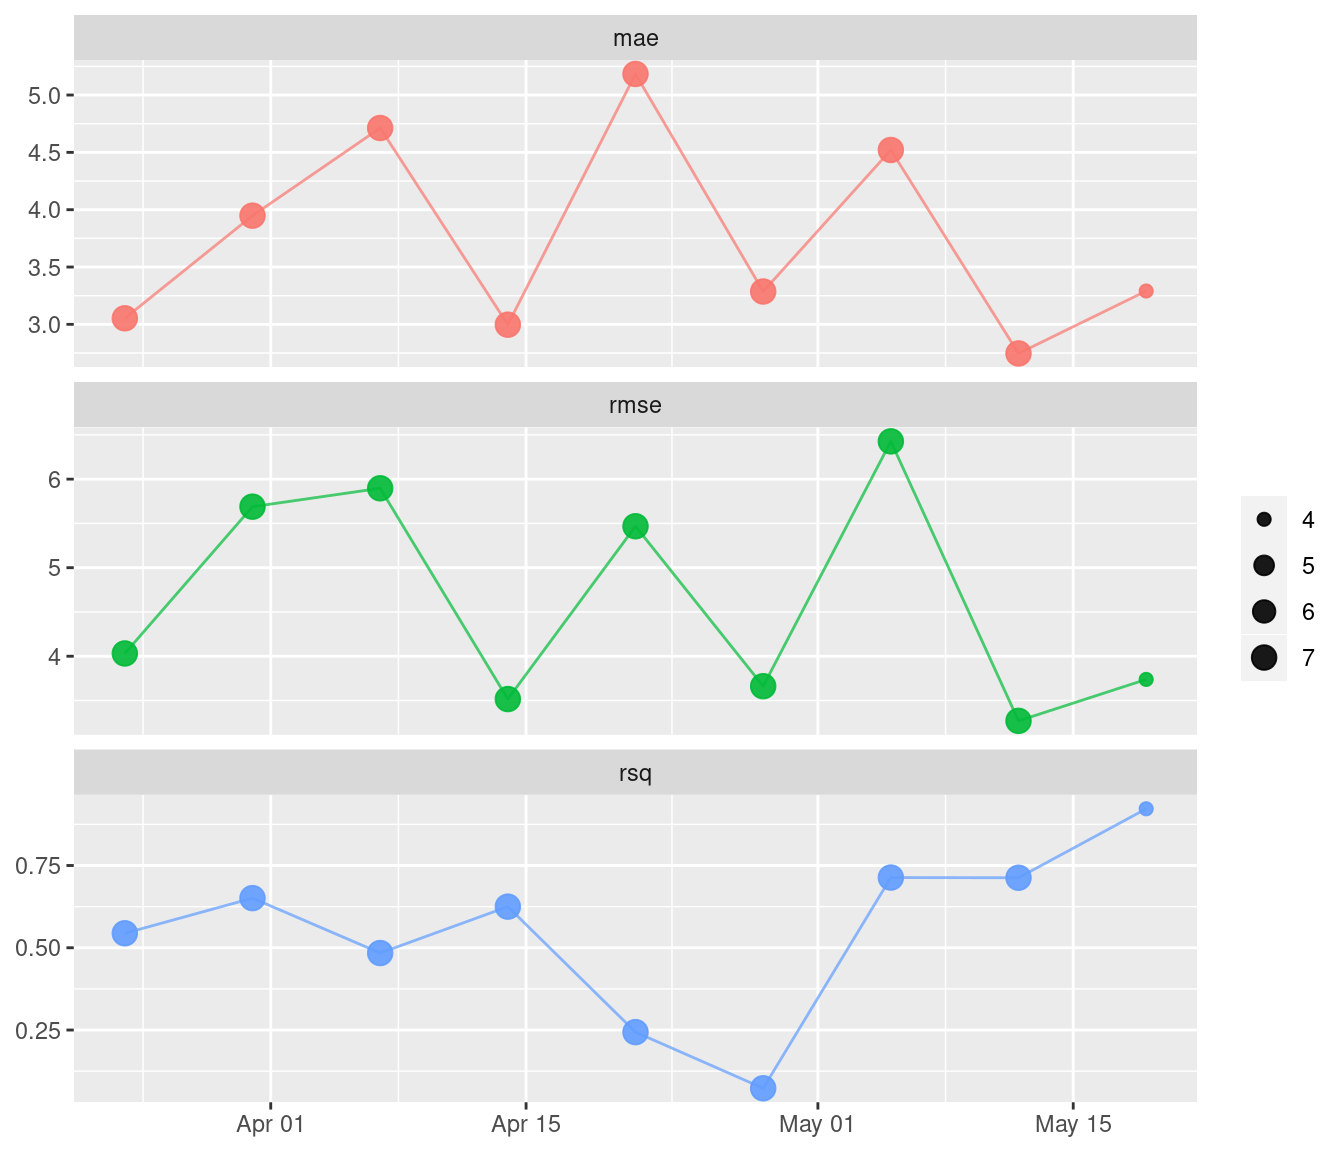
monitoring_metrics = model_board.pin_read("tree_metrics")
p = vetiver.plot_metrics(df_metrics = monitoring_metrics)
p.update_yaxes(matches=None)
p.show()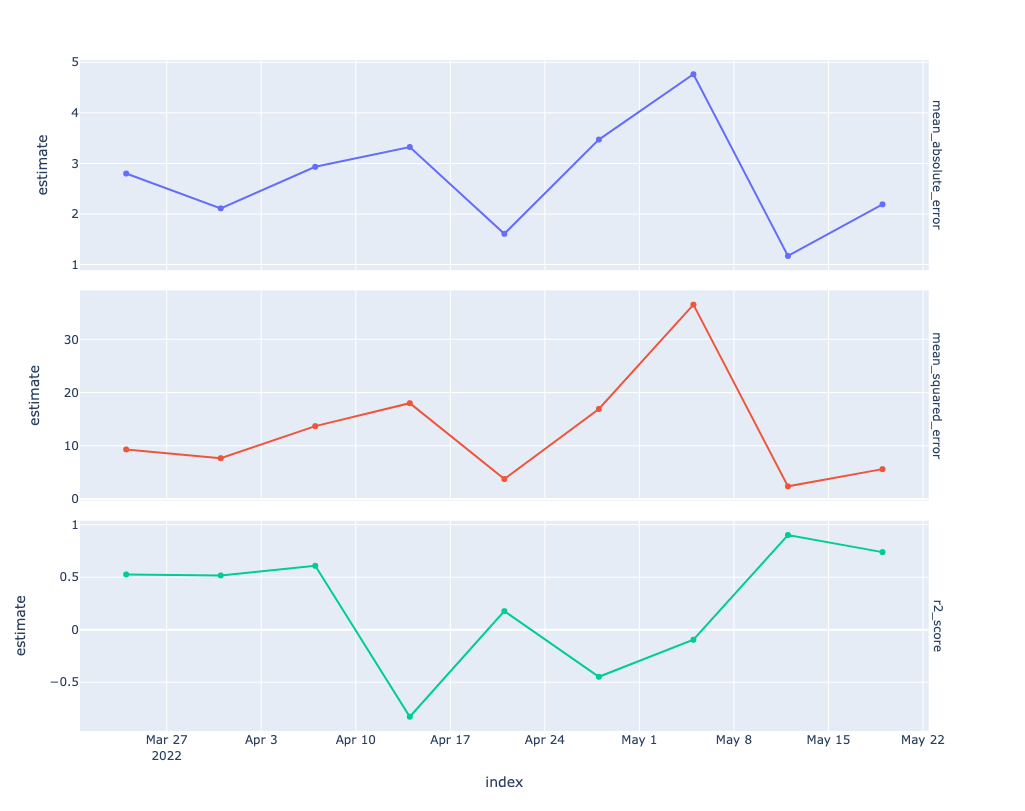
It doesn’t look like there is performance degradation in this small example. You can use these basic functions as composable building blocks for more sophisticated monitoring, including approaches such as equivocal zones or applicability domains.
The vetiver package provides an R Markdown template for creating a monitoring dashboard. The template automates extracting some information from your metrics, and provides a way to extend the dashboard for a custom monitoring implementation.
Keep in mind that the R and Python models have different values for the decision tree hyperparameters.↩︎