import pandas as pd
import numpy as np
from sklearn import model_selection, preprocessing, pipeline, compose
from sklearn.ensemble import RandomForestClassifier

np.random.seed(500)

df = pd.read_csv("https://tidymodels.org/start/case-study/hotels.csv").dropna()
df = df[['arrival_date', 'children', 'average_daily_rate', 'reserved_room_type', 'lead_time', 'country', 'adults']]
df["children"] = df["children"].map({"none": 0, "children": 1}).astype("int64")

# for monitoring example
validation = df.sample(frac=0.10)
df = df.drop(index=validation.index).drop(columns=["arrival_date"])

X, y = df.drop(columns="children"), df["children"]
X_train, X_test, y_train, y_test = model_selection.train_test_split(
    X, y, test_size=0.25
)

categorical_features = ["country", "reserved_room_type"]

oe = compose.make_column_transformer(
    (
        preprocessing.OrdinalEncoder(
            handle_unknown="use_encoded_value", unknown_value=-1
        ),
        categorical_features,
    ),
    remainder="passthrough",
).fit(X_train)
rf = RandomForestClassifier().fit(oe.transform(X_train), y_train)
rf_pipe = pipeline.Pipeline([("oe", oe), ("rf", rf)])Store model metrics as metadata
The vetiver framework creates some metadata automatically for your trained model, such as the packages used to train your model and a description. You can also store any custom metadata you need for your particular MLOps use case, for example, the model metrics you observed while developing your model. When you store and version these metrics together with your model, you make them available to later analysis.
Metrics from model development
For this example, let’s work with data on hotel bookings to predict which hotel stays included children and which did not, using both feature engineering and model estimation. We put these two steps into a single function, such as a pipeline or workflow, and will deploy these pieces together.
library(tidyverse)
library(tidymodels)

hotels <- read_csv('https://tidymodels.org/start/case-study/hotels.csv') %>%
    mutate(across(where(is.character), as.factor))

set.seed(123)
hotel_split <- initial_validation_split(hotels, strata = children)
hotel_train <- training(hotel_split)
hotel_test  <- testing(hotel_split)

## to use for monitoring example:
hotel_validation <- validation(hotel_split)

set.seed(234)
rf_fit <-
    workflow(
        children ~ average_daily_rate + reserved_room_type +
            lead_time + country + adults,
        rand_forest(mode = "classification", trees = 1e3)
        ) %>%
    fit(hotel_train)
Now that our model is trained, we can estimate the model performance we expect to see on new data using our testing data.
from sklearn import metrics

metric_set = [metrics.accuracy_score, metrics.f1_score, metrics.log_loss]

hotel_metrics = pd.DataFrame()
for metric in metric_set:
    metric_name = str(metric.__name__)
    metric_output = metric(y_test, rf_pipe.predict(X_test))
    hotel_metrics = pd.concat(
        (
            hotel_metrics,
            pd.DataFrame({"name": [metric_name],
                          "score": [metric_output]}),
        ),
        axis=0,
    )

hotel_metrics.reset_index(inplace=True, drop=True)
hotel_metrics
name score
0 accuracy_score 0.934645
1 f1_score 0.499658
2 log_loss 2.355647hotel_metric_set <- metric_set(accuracy, mn_log_loss, f_meas)
hotel_metrics <-
augment(rf_fit, new_data = hotel_test) %>%
hotel_metric_set(truth = children, estimate = .pred_class, .pred_children)
hotel_metrics# A tibble: 3 × 3
.metric .estimator .estimate
<chr> <chr> <dbl>
1 accuracy binary 0.940
2 f_meas binary 0.509
3 mn_log_loss binary 0.192There are differences in the metrics reported for R and Python because the models have different values for the random forest hyperparameters.
Note
Metrics to estimate model performance can be computed using different datasets. Notice that these are metrics computed when you are developing the model using the testing data; these tell you how well you expect the model to perform in the future. Another common way to compute metrics in MLOps use cases is when monitoring using new data; these tell you how well your model is performing in practice.
Create a vetiver model
Next, let’s create a deployable model object with vetiver, including our metrics computed during model development.
import vetiver
v = vetiver.VetiverModel(
    rf_pipe,
    prototype_data=X_train,
    model_name="hotel-rf",
    metadata=hotel_metrics.to_dict(),
)
v.description
'A scikit-learn Pipeline model'library(vetiver)
v <- vetiver_model(
rf_fit,
"hotel-rf",
metadata = list(metrics = hotel_metrics)
)
v
── hotel-rf ─ <bundled_workflow> model for deployment
A ranger classification modeling workflow using 5 features
Version your model
We pin our vetiver model to a board to version it. The metadata, including our metrics, are versioned along with the model.
from pins import board_temp
from vetiver import vetiver_pin_write

model_board = board_temp(versioned=True, allow_pickle_read=True)
vetiver_pin_write(model_board, v)library(pins)
model_board <- board_temp(versioned = TRUE)
model_board %>% vetiver_pin_write(v)If we trained this model again with different data and new values for these metrics, we could store it again as a new version and have access to both sets of metrics.
Tip
Like in our article on versioning, we are using a temporary board that will be automatically deleted for this demo. For your real work, you will want to choose the best board for your particular infrastructure.
Extract your metrics metadata
So far, we have walked through how to store metadata, but how do we extract our metrics out to use them?
You can use pin_meta() to retrieve metadata from your board. All custom metadata is stored in a "user" slot; remember that other metadata is also automatically stored for you as well.
metadata = model_board.pin_meta("hotel-rf")
extracted_metrics = pd.DataFrame(metadata.user.get("user"))
extracted_metrics
name score
0 accuracy_score 0.934645
1 f1_score 0.499658
2 log_loss 2.355647extracted_metrics <-
model_board %>%
pin_meta("hotel-rf") %>%
pluck("user", "metrics") %>%
as_tibble()
extracted_metrics# A tibble: 3 × 3
.metric .estimator .estimate
<chr> <chr> <dbl>
1 accuracy binary 0.940
2 f_meas binary 0.509
3 mn_log_loss binary 0.192
Tip
Use the version argument to pin_meta() to get the metadata for a specific model version.
If you already have your vetiver model available, you can alternatively retrieve the metadata directly:
pd.DataFrame(v.metadata.user) name score
0 accuracy_score 0.934645
1 f1_score 0.499658
2 log_loss 2.355647v %>% pluck("metadata", "user", "metrics")# A tibble: 3 × 3
.metric .estimator .estimate
<chr> <chr> <dbl>
1 accuracy binary 0.940
2 f_meas binary 0.509
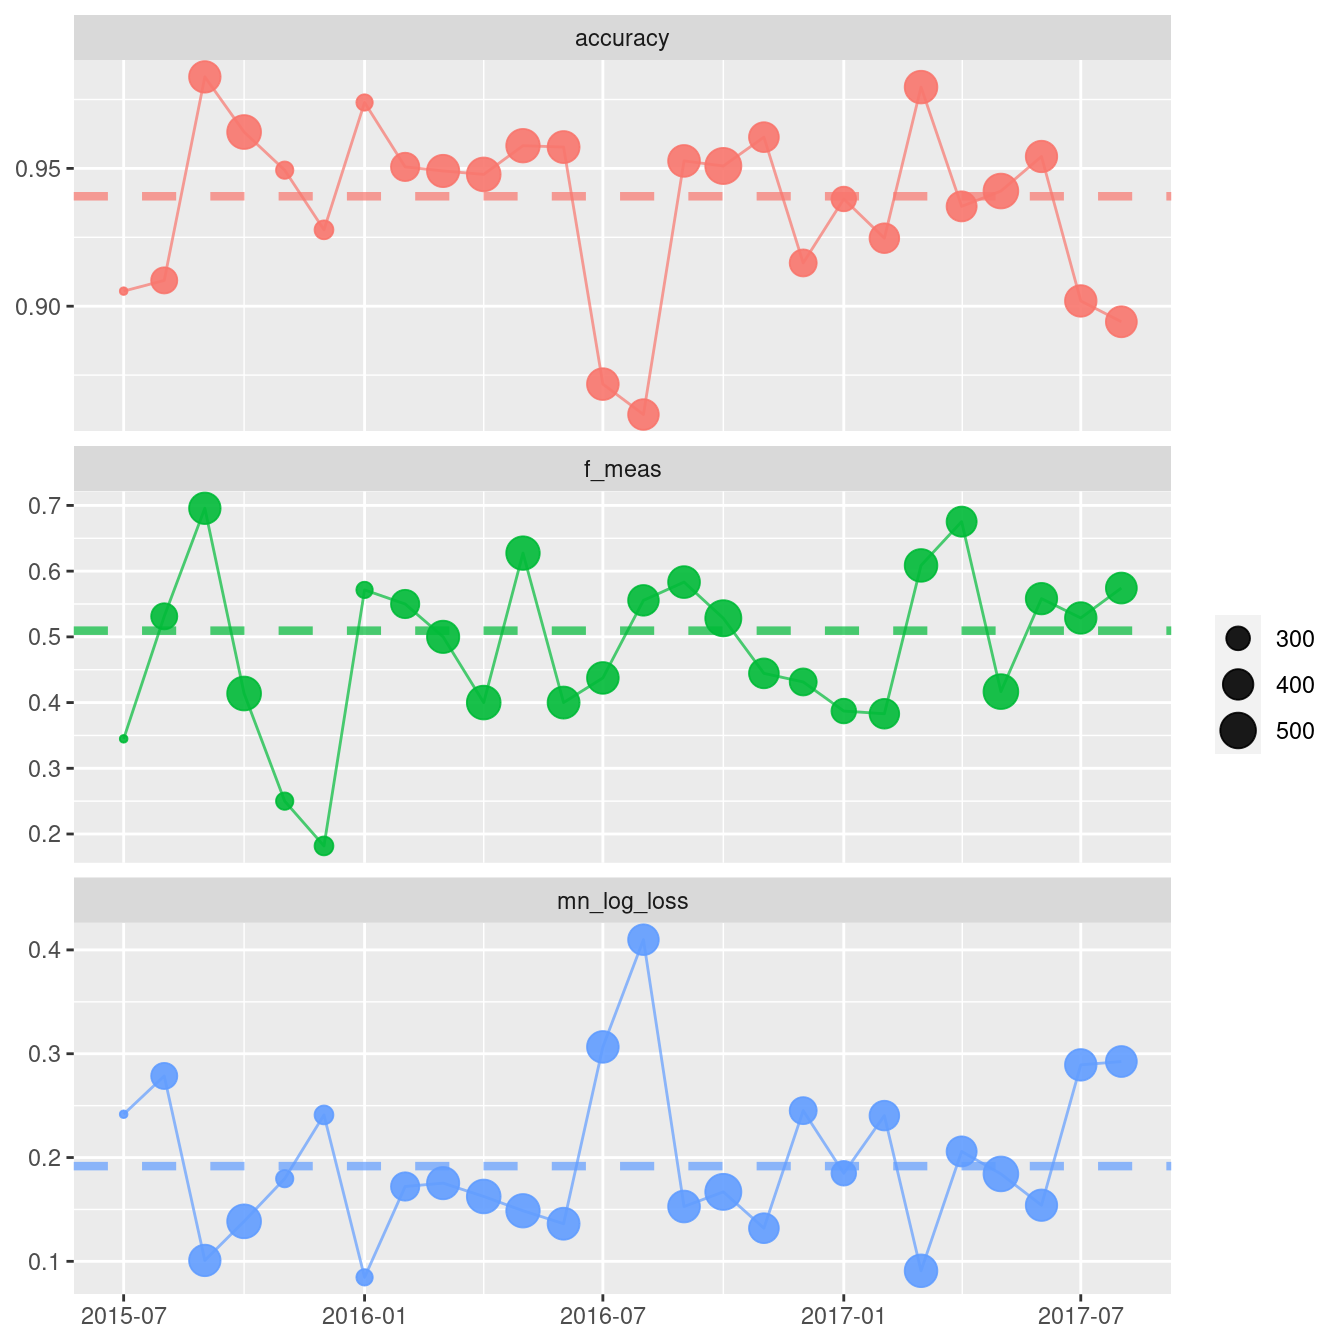
3 mn_log_loss binary 0.192Now that we have extracted_metrics, we can use them, for example, when plotting model monitoring metrics.
## Use model monitoring functions together with validation data to show an example plot
from datetime import timedelta
td = timedelta(weeks= 4)

validation["preds"] = v.model.predict(validation.drop(columns=["children"]))

td_metrics = vetiver.compute_metrics(
    data = validation,
    date_var = "arrival_date",
    period = td,
    metric_set = metric_set,
    truth = "children",
    estimate = "preds"
)

fig = vetiver.plot_metrics(td_metrics)

# plotly rows are counted from 3 to 1
for i, j in zip(range(3), range(3, 0, -1)):
    metric = extracted_metrics.iloc[i,1]
    annotation = extracted_metrics.iloc[i,0]
    fig = fig.add_hline(y=metric, line_dash="dot", row=j)

fig = fig.update_layout(xaxis_title=None)
fig = fig.update_yaxes(matches=None, title = None)
fig.show()
Warning: `includeHTML()` was provided a `path` that appears to be a complete HTML document.
✖ Path: metrics-metadata-python.html
ℹ Use `tags$iframe()` to include an HTML document. You can either ensure `path` is accessible in your app or document (see e.g. `shiny::addResourcePath()`) and pass the relative path to the `src` argument. Or you can read the contents of `path` and pass the contents to `srcdoc`.## use validation data for monitoring example:
augment(rf_fit, new_data = hotel_validation) %>%
arrange(arrival_date) %>%
vetiver_compute_metrics(arrival_date, "month",
children, .pred_class, .pred_children,
metric_set = hotel_metric_set) %>%
vetiver_plot_metrics() +
geom_hline(aes(yintercept = .estimate, color = .metric),
data = extracted_metrics,
linewidth = 1.5, alpha = 0.7, lty = 2)